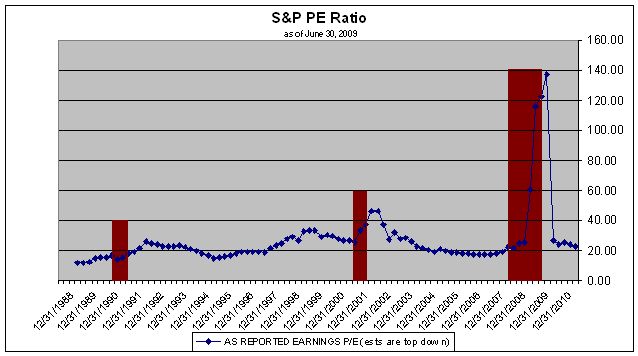

The S&P 500 PE ratio is an important determinant of the value of stock market and the trend of the S&P 500. Historically, the S&P 500 PE ratio has a median of 15.7. Today, the S&P PE ratio is 139 based on a closing price of 1,044 on Friday, September 11, 2009. This assumes the trailing earnings for the S&P 500 companies as reported by Standard & Poor’s for the four quarters ending June 30, 2009. A PE ratio at 139 is not sustainable. What is a reasonable PE ratio for the S&P 500 given our current situation?
The S&P 500 PE ratio reflects the performance expectations of the stock market. In the last three quarters, the PE ratio has leapt higher with the plunge in earnings of the S&P 500 companies. The fall in earnings overcame the drop in the value of shares in early March 2009.
Even with the recovery in the markets since the lows in March, the S&P 500 PE ratio remains very high as the trailing four quarters of earnings is so low. According to data from Standard & Poor’s on the S&P 500, as reported earnings for 99% of all reporting companies, creates an S&P 500 PE ratio of 122.41 as of June 30, 2009. The trailing four quarters of earnings was $7.51. Two years ago the as reported earnings for the S&P 500 companies was $84.92 for the quarter ending on June 30, 2007. The S&P 500 PE ratio was 17.70. This plunge in earnings is what caused the S&P 500 PE ratio to rise so high.
As shown on the chart below the S&P 500 PE ratio rose to 122 for the quarter ending June 2009. The estimates through the end of 2010 are from Standard & Poor’s for earnings and the S&P PE ratio.
The

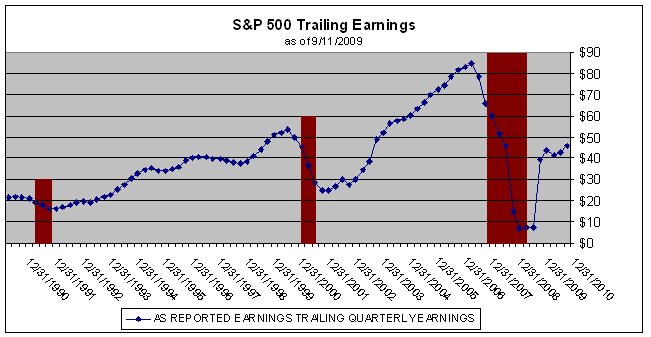
Standard & Poor's has forecast earnings through the end of 2010. The chart below shows actual trailing annual earnings since the June 1990 through June 2009. It also includes the forecast for earnings through December 2010.
What stands out is the sudden jump in earnings that begins with the quarter ending December 2009. Part of this sudden change is due to the large drop in earnings reported for December 31, 2008. For the quarter ending December 31, 2009 the S&P 500 delivered $23.25 in losses for that quarter alone due to the large write-offs in the financial sector.
Once the major write-offs are no longer part of the four quarter trailing earnings, the annual earnings return to a forecasted $41 to $45 range for the S&P 500. This earnings forecast provides a basis to project what the S&P 500 index could achieve over the next 12 - 15 months.

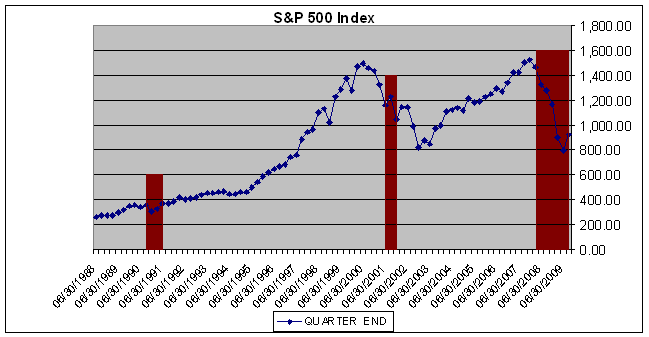
In the recession of 1990 – 1991, the S&P index began to climb before the end of the recession. Following the end of the 2001 recession, the S&P 500 fell another 200 points before rebounding. So far in the recession of 12/2007 - ?, the S&P 500 fell significantly and has turned up through June 2009. We know it is trading above 1,000 as of the middle of September 2009.

Looking at the earnings forecast from Standard & Poor’s we can assess which way the S&P 500 will likely move for the remainder of 2009 and all of 2010.
The table below uses the trailing four-quarter earnings from Standard & Poor’s. It then applies a PE ratio to derive the S&P 500 index forecast. When looking at the table, keep in mind that the median PE ratio is 15.7. In addition, the PE ratio is mean reverting, so we should expect it to fall further, possibly to 15 or lower. The very low S&P trailing earnings for June and September 2009 are due to the large loss reported in December 2008 quarter.

Using the December 2009 quarter the earnings forecast
$39.35 and a PE ratio of 30 gives us a target price for the S&P 500 index of
1,181. On Friday
This examination of earnings and S&P PE ratios is telling us to expect a higher S&P 500 index throughout 2009, as long as the PE ratio remains in the 25-30 range. Whether this is correct, depends on several factors. First, are the earnings forecast correct? Investors should monitor earnings expectations throughout the year, looking for any changes either up or down. The estimates for all of 2010 are higher now than they were in June, indicating S&P is expecting a more robust recovery.
Second, evaluate your PE ratio assumptions based on the outlook for the economy and the markets. If earnings are running above the forecast from Standard & Poor’s, then you should could expect the PE ratio to hold in the 25 - 30. On the other hand, if earnings expectations are falling, then you should expect the PE ratio to fall further. In each case, any move in the PE ratio will cause a significant move in the S&P 500 index.
Yale University Professor Robert J. Shiller, author of
Irrational Exuberance: Second Edition
![]() uses a modified PE ratio that smoothes out the volatility in the ratio. The
denominator of this modified ratio is average inflation-adjusted earnings
over the trailing 10 years. Shiller calls this modified ratio "p/e10." Using
this data the modified ratio “p/e10” produces a PE ratio of slightly over 15,
which is very close to the median of 15.7. In December 2007, the beginning of
the current recession, the “p/e 10” was 25.95. Since markets tend to cycle above
and below the median, we should expect the “p/e 10” to fall further before
turning back up.
uses a modified PE ratio that smoothes out the volatility in the ratio. The
denominator of this modified ratio is average inflation-adjusted earnings
over the trailing 10 years. Shiller calls this modified ratio "p/e10." Using
this data the modified ratio “p/e10” produces a PE ratio of slightly over 15,
which is very close to the median of 15.7. In December 2007, the beginning of
the current recession, the “p/e 10” was 25.95. Since markets tend to cycle above
and below the median, we should expect the “p/e 10” to fall further before
turning back up.
Using December 2009 trailing four-quarter earnings of $39.95 times the median PE ratio of 15.7 gives us an S&P 500 index of 627. This gives us a range for the S&P index of a high of 1,375 assuming an S&P PE ratio of 30 to a low of 675 with a PE ratio of 15.7, the median. The risk is to the down side.
Investors still need to understand if the S&P 500 PE ratio will rise or fall. If Professor Shiller is correct, then we should look for a drop in the S&P 500 PE ratio. On the other hand if the current PE ratio remains in the 25 - 30 range, then we could see the S&P 500 index rise further driven only by higher earnings.
For investors a PE ratio in the 25 to 30 range means it will be difficult to find bargains, as you cannot expect an expansion of the PE ratio to contribute a higher level on the S&P 500 index. Moreover, there is a risk the S&P PE ratio could contract, causing the level of the S&P 500 index to fall. A drop to 20 on the S&P 500 PE ratio gives us a high of 917 on the S&P 500, assuming earnings does not change from its forecast. Going forward investors need to keep in mind that the risk of a PE ratio contraction is a possibility. A rise in the S&P 500 PE ratio is unlikely.
Our Premium Members receive weekly updates on important and relevant trends for the stock market, industry sectors and individual stocks and ETFs. By following the trends and using fundamental analysis, we have beat the market every year since our inception. You should give our four-week free trial to the Premium Membership a try. There is no risk, nor any obligation. If you have any questions regarding membership, please send an email to [email protected] and we will get right back to you. Your complete satisfaction is of utmost importance to us.