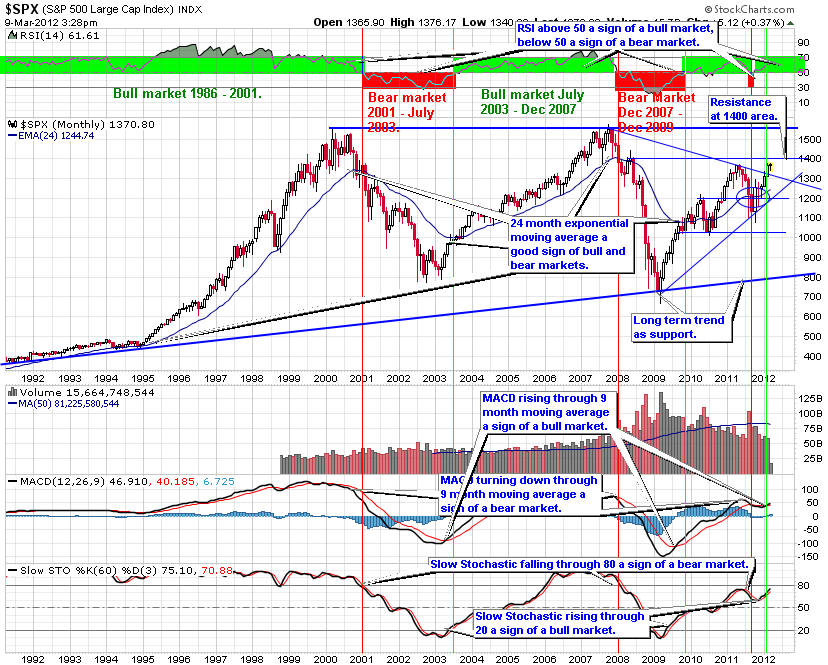

Starting with the indexes gives an overall perspective to the markets. This is monthly chart for the S&P 500 showing 20 years of performance. Since this index is the one used by professional traders, it is important to understand how it is performing. This chart is also excellent for defining the longer term trends for the market.
The bull market of the last five years broke down when the S&P 500 turned down through the 24-month exponential moving average. The bear market began when the index fell through the 24-month exponential moving average. Also, the RSI tested the 50 level, another important indicator of bear markets (if the RSI remains below 50 then we are in a bear market) and turned back down. The MACD crossing down through zero is another sign of the transition from bear market to bull market. Finally, the Slow Stochastic fell through 80 as another sign of the beginning of the bear market.
The rally that began in early March continued to rise through September. Volume has fallen off each month, a sign of waning interest, though it is above average. A pull back here would be normal. The Slow Stochastic did rise above 20, an early sign of a transition from a bear to a bull market. It will be important to see what happens in October.
Looking at the chart we are getting close to testing the last bear market signals. While we can say we are still in a bear market, we could be near a change. The Slow Stochastic has already signaled an end to the bear market. The MACD is telling us the bear market is over. The 24-month Exponential Moving Average is less than 70 points away.
While history may not repeat itself, notice that in the bear market of 2001 - 2003, there was a bear market rally during April and May 2002 that reversed itself. It was another year before the bear market was over. Just something to bear in mind as we enter October, as it has been historically the one of the worst months of the year. The best investors focus on the risk before they concentrate on the reward.
For now, I intend to invest as though we are in a more normal market that will see rallies and then pull backs. The rally of the last six months came as a rebound from an oversold condition as investors feared the worse. Going forward we will experience market rallies and pull backs as the economy struggles to expand.
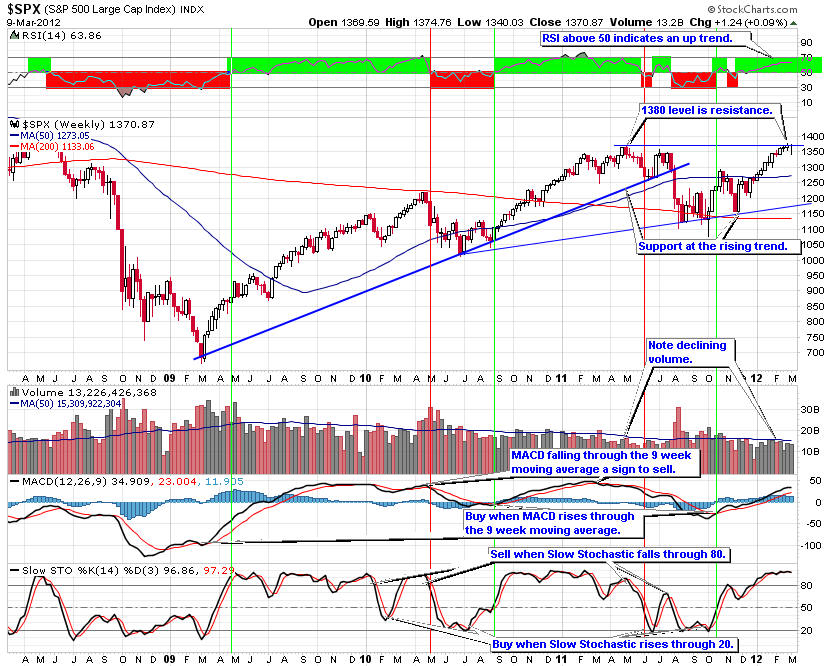
The four-year weekly S&P 500 trend chart shows more closely the transition from a bull to a bear stock market. So far, the descending trend is the primary resistance level for this view of the bear market.
Earlier this year the S&P 500 fell through support at the 800 level down to the 650 area. The S&P 500 trend then reversed course, generating a nice rally pushing through resistance at the 970 and 1,025 level, my target for our Premium Members.
The rally seems to have stalled, though it has not fallen though support of the rising trend.
RSI is above 50, a sign of an up trend. The MACD continues to rise though it is reaching a high point where it will eventually turn down, giving a sell signal. The Slow Stochastic remains above 80, though it is poised to turn down. When it does it will give a sell sign.
The weekly chart pattern indicates the S&P 500 trend remains intact. Support remains at the rising trend, though the slope is steep and unsustainable. The rally is consolidating its gains. If support of the rising trend fails, it is another indication the rally would be over. From the weekly chart perspective, the rally is still intact.
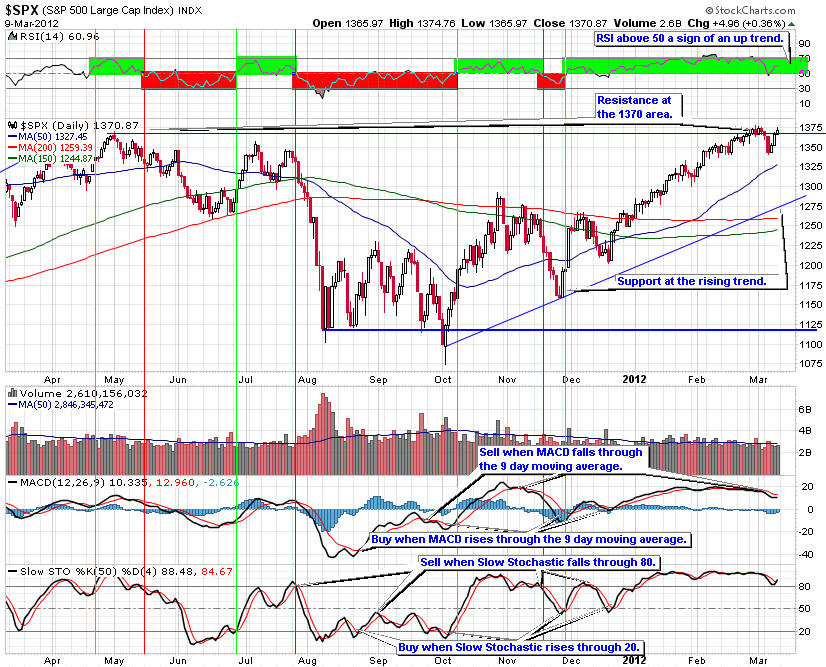
The daily S&P 500 shows the formation of a small rising wedge, a bearish formation as indicated by the thin blue trend lines. The lower uptrend provides additional support that is being tested. Should this support level fail, it is a sign the rally is over. Though it does not necessarily mean the market will plunge down.
RSI is below 50 indicating a down trend. The MACD turned down at 9-day moving average, a sell sign. The Slow Stochastic turned down through 80, giving a sell sign.
The daily chart of the S&P 500 is telling us the rally is ending and it is prudent to add down side protection to your portfolio and/or sell long positions. However, we are likely entering a period of consolidation with the market trending more sideways with multi-week rallies followed by multi-week pull backs.
This will cause us to change our strategy going forward. Stock picking will become more important and you should look to buy on dips in the market to important support levels. Then add down side protection at interim high points using trailing stops and protective put options to help improve the overall return. Covered calls options will also work well when the market is not rising as rapidly as the last six months.
Given this analysis of the S&P 500 trend line charts, it is important to have your portfolio positioned for a market that is more likely to trend sideways with more cyclical rallies and pull backs. We could see the first of these moves with a pull back beginning in early October.
The charts of the S&P 500 trend lines provide a good way for investors to align their portfolios with the overall market trends. Picking the right sectors and stocks will become even more important. Look to buy on dips in the price of the S&P 500 trend charts on the next pull back. Be sure to use proper capital management techniques including trailing stops, protective put, covered call options and position sizing. When the pull back ends, look to add to long positions with stocks and ETFs from the sectors that are likely to outperform the overall market. Keep in mind, Warren Buffett's first rule of investing is to not lose money. Be patient waiting for good entry points.
Our Premium Members receive weekly analysis of market trends of all major indexes and industry sectors. They also receive frequent updates when conditions warrant, so they are prepared to trade and invest with the trend. Moreover, our stock and sector portfolios have beat the market every year since our inception in 2005. For 2009, our stock portfolio is up over 14% for the year.
Try the free four week subscription to our Premium Members pages and receive:
If you decide to continue at the end of the four-week trial your subscription starts automatically. If you decide to cancel before the end of the trial, you will not be charged a thing. No risk, no obligation.
Give the Premium Membership a try. You have nothing to lose and a lot to gain and we have beat the market every year since our inception.