
This is a free monthly newsletter on stock market trends to help you to learn to invest. Following the trend is a proven way to beat the market and grow your stock portfolio. Basic technical analysis provides the tools to identify and follow the market trends using the S&P 500.
To identify the stock market trend, it is best to begin with the big picture in mind and then work our way down to weekly and then daily views of the charts. You will notice that the chart and the value of the indicators change as we move from a monthly to a weekly and then a daily chart. This is a normal part of the technical analysis.
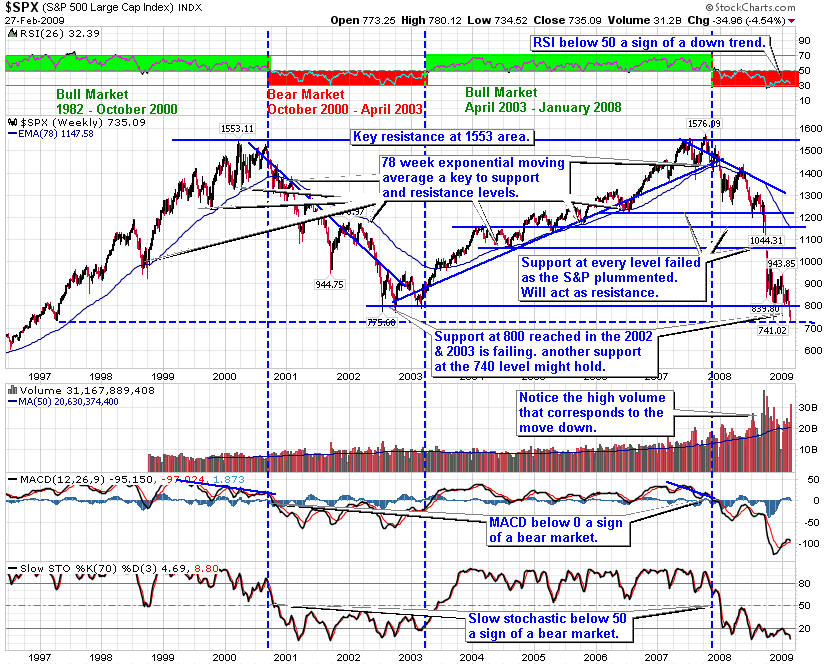
Let's start with the long term view of the S&P 500. The Relative Strength Index (RSI) is a good indicator of the cyclical bull and bear markets. In addition, the 78 week Exponential Moving Average (EMA) acts as support in a bull market and resistance in a bear market.
In January 2008 we fell into a bear market as the RSI dropped below 50. The index fell through the rising trend line and the 78 week exponential moving average and MACD crossed below zero. This is consistent with the fundamentals of a weakening economy, and a recession. In a bear market, the general trend is down. Investors should have down side protection in place and use the short Exchange Traded Funds (ETFs) to capture additional profit.
The S&P 500 has fallen to the lows of 2002 - 2003, the last bear market. This does not mean the current bear market is over. Rather we might see a rally for several weeks to months before retesting of the lows of this bear market.
The MACD is turning up, giving a buy sign. This means we have reached an interim bottom, not an overall market bottom. The Slow Stochastic is poised to rise up through 20, another buy sign when it does.
The 78 week exponential moving average and the bear market down trend remain as key resistance for the bear market.
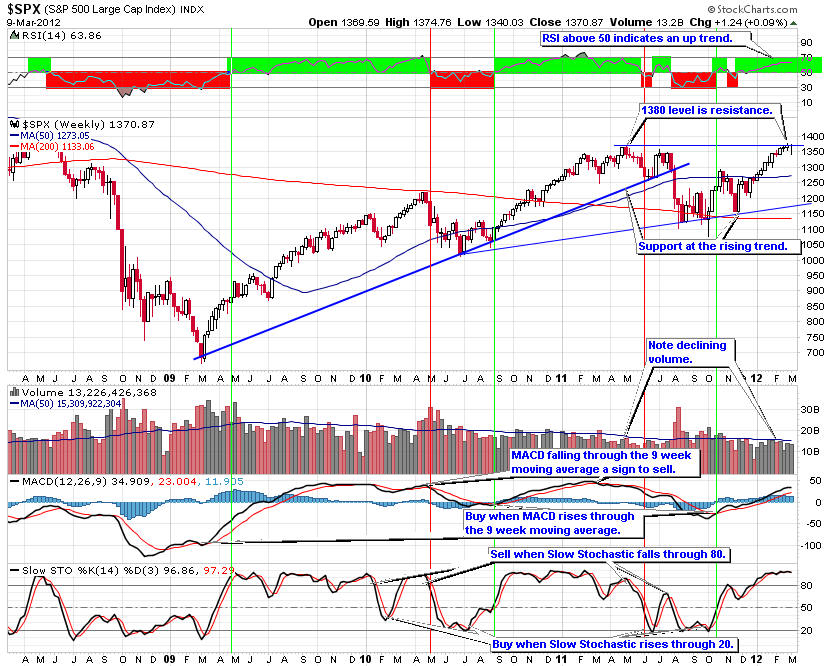
The three year weekly S&P 500 chart shows more closely the transition from a bull to a bear market. So far the descending trend line and the 50 week moving average are the primary resistance for this bear market.
Most recently the index formed a flag pattern, a bullish formation, after setting a new three year low. This was a sign a rally was possible, which could be underway.
RSI below 50 indicates a down trend. MACD turned up through the nine week moving average, a buy sign. Slow Stochastic rose through 20, another buy sign.
Long term the trend is still down, but we are likely to see consolidation at this level and possibly a rally up to 1,000 and maybe even resistance at the 1200 area.
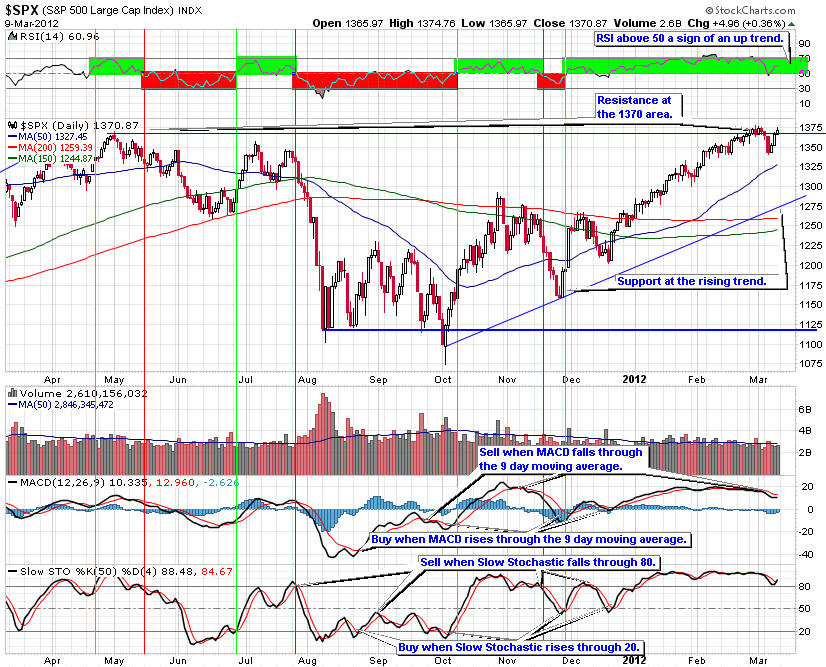
In the daily S&P 500 chart below, a descending channel formed. Most recently the S&P 500 broke through the upper down trend, generating a buy sign.
RSI is below 50 indicating a down trend. Earlier the MACD rose up through the nine day moving average, a buy sign. It continues to trend upward, pushing through the zero level, another important positive sign. However, it could be turning down, giving a sell sign. The Slow Stochastic signaled a buy when it moved up through 20. However, the Slow Stochastic turned down as it rose through 50, a sign of weakness. The indicators are telling us the market is at a decision point, continuing to rally of pull back.
The S&P 500 is back testing its break out through the 50-day moving average. If this test holds, look for the market to continue to rally. If it fails, then the market is more likely to falter and possibly test the prior lows. If we get strong buying volume it will be a positive sign. If we do not then it will be a signal that the market is more likely to pull back. If you are long, you should considering selling at least half of your position and/or adding down side risk protection on any move down.
If the rally continues, then significant resistance will be encountered at the 200 simple and exponential moving averages, and the descending trend line.
In bear markets it is best to be nimble and/or use risk protection such as trailing stops, protective put options and even covered call options. On a sign the market is unable to penetrate resistance, you might consider using the short and ultra short Exchange Traded Funds (ETFs).
Given this perspective, it is important to have your portfolio positioned for a short term rally and a long term bear market. This means investors should assess their long positions to see if they are ready for a multi week to multi month rally. Then once the rally is over, they need to be ready to short the market as we will likely see a test of the recent lows.
When the market falls during a bear market you should either be in cash or be short. The short and ultra short ETFs are good ways to short the market without having to depend on selecting specific stocks.
While it is tempting to buy when the market falls, it is a better strategy to be sure the market has formed a base. Most likely the prices of many companies will be even lower. Follow the stock market trend works. That doesn't mean you cannot buy high quality companies that are in sectors that are trending up. Just keep in mind, Warren Buffett's first rule of investing is to not loose money. Patience is key when markets are moving down.
Request a free four week subscription to our Premium Members pages and receive:
If you decide to continue at the end of the four-week trial your subscription starts automatically. If you decide to cancel before the end of the trial, you will not be charged a thing.
Give the Premium Membership a try. You have nothing to lose and a lot to gain and we have beat the market every year since our inception.