
This is a free monthly newsletter on stock market trends to help you to learn to invest. Following the trend is a proven way to beat the market and grow your stock portfolio. Basic technical analysis provides the tools to identify and follow the trends of the market as determined by the S&P 500.
It is best to begin with the big picture in mind and then work our way down to weekly and then daily views of the charts. You will notice that the chart and the value of the indicators change as we move from a monthly to a weekly and then a daily chart. This is a normal part of the technical analysis.
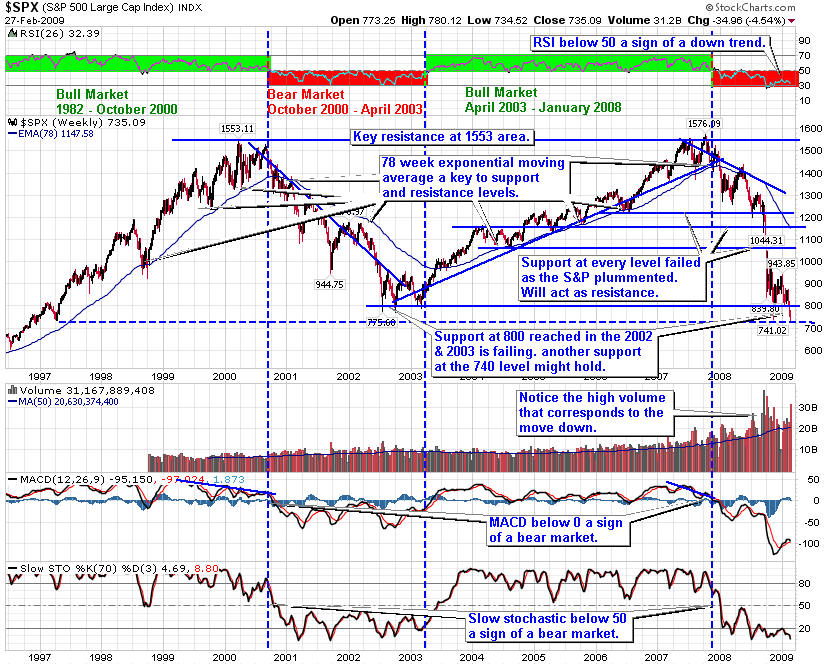
Let's start with the long term view of the S&P 500. The Relative Strength Index (RSI) is a good indicator of the cyclical bull and bear markets. In addition, the 78 week Exponential Moving Average (EMA) acts as support in a bull market and resistance in a bear market.
In January we fell into a bear market as the RSI dropped below 50. The index fell through the rising trend line and the 78 week exponential moving average and MACD crossed below zero. This is consistent with the fundamentals of a weakening economy, and a recession. It is best to remain nimble during times like this.
The first support level looks to be just above the 1200 level. We briefly tested this support level before rebounding. The 78 week exponential moving average remains as resistance.
The weekly S&P 500 below was in a bullish ascending triangle that broke to the down side. The recent move up turned back down at the 50 week moving average.
Support is now at the 1230 area. RSI below 50 indicates a down trend. MACD fell through the 9 week moving average, a sell sign. Slow Stochastic is has risen through 20, a buy sign, though this can be early..
As predicted the market tested the 50 week moving average and then turned back down. We are likely to see a rebound up from here. Just keep in mind the overall trend is still down, so any move up is temporary and likely to only last a few weeks.

The daily S&P 500 chart below a small ascending triangle forming (dotted lines). This is a bullish formation indicating we are more likely to see a move up soon. If we get a move up, look for resistance at the descending trend line and the 200 simple and exponential moving averages.
RSI is below 50 indicating a down trend. The MACD turned up through the 9 day moving average, a buy sign. The Slow Stochastic signaled a buy when it moved up through 20.
In bear markets it is best to be nimble and/or use risk protection such as trailing stops, protective put options and even covered call options. Of course you can go short or use any of the short Exchange Traded Funds (ETFs).

Given this perspective, it is important to have your portfolio positioned for bear market. I expect the market to rebound from this support level. However, any move up will only last a few weeks before turning back down. Any rebounds are good places to add more down side protection by using short ETFs, put options or covered calls. Of course you can also sell long positions that can be bought back after they have fallen further.
While it is tempting to buy when the market falls, it is a better strategy to be sure the market has formed a base. Most likely the prices of many companies will be even lower. That doesn't mean you cannot buy high quality companies that are in sectors that are trending up. Just keep in mind, Warren Buffett's first rule of investing is to not loose money.
Try the free four week subscription to our Premium Members pages and receive:
At the end of the four week trial if you decide to continue you may continue with either a quarterly or annual subscription. If you decide to cancel before the end of the trial, no problem. You will not be charged a thing.
Give the Premium Membership a try. You have nothing to lose and a lot to gain and we have beat the market every year since our inception.